Our potential inhibitors are expected to effectively inhibit the binding between Aca1 and acr-promoter. Therefore, in our two-plasmid reporter system for screening the most effective inhibitors, we expected the following results: in the absence of an inhibitor, Aca1 can effectively bind to acr-promoter, blocking the expression of eGFP, causing the strength of fluorescence to decrease; with the presence of inhibitor, the inhibitor binds with Aca1 and disrupts its normal binding with acr-promoter, and thus acr-promoter can promote the expression of eGFP and make the strength of fluorescence in measurement recover to a normal level.
Model
evaluation is important!
Overview
Introduction
In order to evaluate the efficiency of our PDI inhibitor candidates with the fluorescence strength we measured, we developed a model about the inhibition process of the inhibitor with our reporter system. In this model, we use a constant named in vivo KI to evaluate the in vivo efficiency of inhibitor candidates. (We decided not to develop a model to evaluate the efficiency of our PPI inhibitor candidates because it is obvious that PPI inhibitors are far less effective than PDI inhibitors.)
Conclusion
Compared with normal KI that is measured through biochemical approaches, our in vivo KI can directly reflect the inhibition efficiency of potential PDI inhibitors. When measuring the exact binding affinity between potential PDI inhibitor and Aca1 protein, it is better to measure the exact KI with biochemical approaches. However, because the intracellular local concentration of some molecules may differ from the concentration of those molecules in whole cells, we think that our evaluation of inhibition efficiency through in vivo KI is more practical.
In conclusion, this model can provide us with a way to evaluate the efficiency of certain PDI inhibitors in our reporter system and help us screen effective PDI inhibitors towards Aca1 protein. Also, it is worth mentioning that when our reporter system is applied to screen other effective inhibitors for the interaction between phage specific proteins and their target promoters, our model is still practicable to evaluate the inhibiting efficiency of potential inhibitors.
Model Design
The PDI inhibitor candidates work on Aca1-dimers instead of monomers and can bind to the DNA binding site of Aca1 proteins, with the binding of one PDI inhibitor is supposed to sufficiently inhibit the normal function of Aca1 dimer. Here we assume that binding of PDI inhibitors can block the dissociation of Aca1 dimer, just like the binding of DNA can stabilize Aca1 dimer. Therefore, the dimerization process of Aca1 is not taken into consideration in this model. Similarly, considering possible cooperation binding of PDI inhibitors (binding of the first PDI inhibitor can effectively inhibit the binding of the second PDI inhibitor), we only take into account the first binding of PDI inhibitor to Aca1 dimer.
Under such conditions, we use our model to measure a constant, named after in vivo KI, to evaluate the efficiency of PDI inhibitors in bacteria.
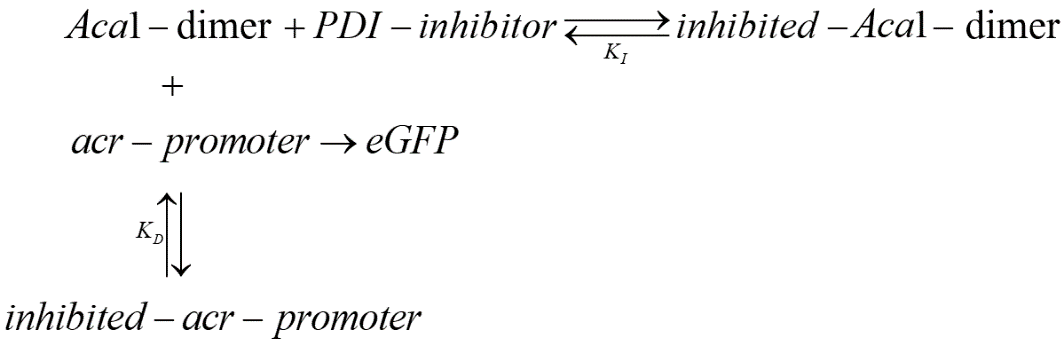
![\begin{equation*} K_I=\frac{[Aca1-dimer][PDI-inhibitor]}{[inhibited-Aca1-dimer]} \end{equation*}](https://www.arterylee.com/wp-content/ql-cache/quicklatex.com-e39ca498fcdbe698ac623015986870d2_l3.png "Rendered by QuickLaTeX.com")
![\begin{equation*} K_D=\frac{[Aca1-dimer][acr-promoter]}{[inhibited-acr-promoter]} \end{equation*}](https://www.arterylee.com/wp-content/ql-cache/quicklatex.com-d01a1f21cbea4fcc30845ad333fe7831_l3.png "Rendered by QuickLaTeX.com")
In this system, available acr-promoter can promote the expression of eGFP, so we suppose that the concentration of eGFP is in proportion to the concentration of available acr-promoters. Also, we have
![\[ c(eGFP)\propto I_{fluorescence} \]](https://www.arterylee.com/wp-content/ql-cache/quicklatex.com-5e775354dd1499881db06c5bee14b9f1_l3.png "Rendered by QuickLaTeX.com")
where Ifluorescence is the strength of the fluorescence we measure in the experiments. Therefore, we can get
![\begin{equation*} [acr-promoter]=kI_{fluorescence} \end{equation*}](https://www.arterylee.com/wp-content/ql-cache/quicklatex.com-62eb255f794a1cdade24b4b60a1c210e_l3.png "Rendered by QuickLaTeX.com")
where k is a constant. Specifically, with the absence of the plasmid expressing Aca1 and the presence of the plasmid having egfp downstream of acr-promoter, we can measure k as
(4) 
where I1 is the strength of the fluorescence in positive control.
![\begin{equation*} c(PDI-inhibitor)=[PDI-inhibitor]+[inhibited-Aca1-dimer] \end{equation*}](https://www.arterylee.com/wp-content/ql-cache/quicklatex.com-9a59bb9ccff7c7ef94add685375e78ea_l3.png "Rendered by QuickLaTeX.com")
![\begin{equation*} c(acr-promoter)=[acr-promoter]+[inhibited-acr-promoter] \end{equation*}](https://www.arterylee.com/wp-content/ql-cache/quicklatex.com-0bb1fbf7f5ac202d70e072a8b0876be9_l3.png "Rendered by QuickLaTeX.com")
![\begin{equation*} c(Aca1-dimer)=[Aca1-dimer]+[inhibited-Aca1-dimer] \end{equation*}](https://www.arterylee.com/wp-content/ql-cache/quicklatex.com-3b6bdbe89fd1e01af3e56ec5643cf952_l3.png "Rendered by QuickLaTeX.com")
We are going to talk about two conditions in this model.
The first condition is the negative control condition in the experiment where no PDI inhibitor is added to the system. Under this condition,
(8) ![\begin{equation*} c(PDI-inhibitor)=[PDI-inhibitor]=[inhibited-Aca1-dimer]=0 \end{equation*}](https://www.arterylee.com/wp-content/ql-cache/quicklatex.com-9a3cfd158032c7e0b8c99d7a9623147f_l3.png "Rendered by QuickLaTeX.com")
and
(9) ![\begin{equation*} c(Aca1-dimer)=[Aca1-dimer] \end{equation*}](https://www.arterylee.com/wp-content/ql-cache/quicklatex.com-fae4b303bb841fb35c3f55552c73ab43_l3.png "Rendered by QuickLaTeX.com")
We define the strength of fluorescence we measure in this condition as I0. Therefore, from equation (3), we can get
(10) ![\begin{equation*} [acr-promoter]=kI_0 \end{equation*}](https://www.arterylee.com/wp-content/ql-cache/quicklatex.com-7fb1920f5859802fb6f36f2af3609654_l3.png "Rendered by QuickLaTeX.com")
Taking equation (2), (6), (9), and (10) together, we can get
![\[ K_D=\frac{c(Aca1-dimer)\cdot kI_0}{c(acr-promoter)-kI_0} \]](https://www.arterylee.com/wp-content/ql-cache/quicklatex.com-410347c24129824f5093efb08c7c88e8_l3.png "Rendered by QuickLaTeX.com")
and therefore, we generate a measurement of the original concentration of Aca1-dimer
(11) 
Next, we are going to talk about the experimental condition where c(PDI-inhibitor) of the PDI inhibitor is added to the reaction system. In an ideal situation, c(acr-promoter) and c(Aca1-dimer) in the experiment are strictly maintained to be the same as those in the negative control. Therefore, with equation (11), we can build a bridge between those two conditions in order to roughly measure KI, and thus the efficiency of the PDI inhibitor. With the strength of fluorescence measured in experiment being I, from equation (2), (3), (6), and (7), we get
(12) ![\begin{equation*} [Aca1-dimer]=\frac{c(acr-promoter)\cdot K_D}{kI}-K_D \end{equation*}](https://www.arterylee.com/wp-content/ql-cache/quicklatex.com-8f31f9a74e4d42e2f3461b4ce3456ac5_l3.png "Rendered by QuickLaTeX.com")
Then, with equation (6) and (11), we can generate [inhibited-Aca1-dimer] as
(13) ![\begin{equation*} [inhibited-Aca1-dimer]=\frac{c(acr-promoter)\cdot K_D}{k}\cdot (\frac{1}{I_0}-\frac{1}{I}) \end{equation*}](https://www.arterylee.com/wp-content/ql-cache/quicklatex.com-8ed3451af51b783a1a64ce07e9a417ba_l3.png "Rendered by QuickLaTeX.com")
Taking equation (1), (4), (5), (12) and (13) together, KI can be measure as
(14) 
According to the research by Stanley et al., KD has a value of around 50 nM1, which is far smaller than kI, so we can estimate KI as
(15) 
By replacing k using equation (4), we can simplify equation (15) as
(16) 
where KI is in vivo inhibitory constant of a specific PDI inhibitor, c(PDI-inhibitor) is the concentration of the PDI inhibitor in the system, I1 is the strength of the fluorescence in the positive control, I0 is the strength of the fluorescence in negative control and I is the strength of the fluorescence in the experimental group.
Clearly, KI decreases as I increase. Therefore, increasing in I reflects a higher binding affinity between PDI inhibitor and Aca1 dimer, which indicates a better inhibiting effect of PDI inhibitor. In some cases, the PDI inhibitor candidate may be harmful to E.coli, disrupt the normal expression of GFP in E.coli, and therefore causes I to be smaller than I0 in the negative control and KI to be negative.
Screening Effective PDI Inhibitor for Aca1
We applied our model to evaluate the efficiency of different PDI inhibitor candidates and found that 1400-C4 has the smallest in vivo KI among those candidates. Therefore, we concluded that 1400-C4 could have the best inhibition efficiency and focused on 1400-C4 in the further experiment process.
Table 1. in vivo KI of different PDI candidates
| compounds | c(PDI-inhibitor) (μM) | I0 | I | I1 | KI (μM) |
|---|---|---|---|---|---|
| 1388-F10 | 19 | 167401 | 191357 | 1446723 | 115.2079 |
| 1388-B9 | 19 | 167401 | 192753 | 1446723 | 108.743 |
| 1401-H11 | 19 | 167401 | 220510.3 | 1446723 | 50.75995 |
| 1401-G2 | 19 | 167401 | 222787 | 1446723 | 48.58307 |
| 1402-C10 | 19 | 167401 | 227404.7 | 1446723 | 44.6751 |
| 1388-D4 | 19 | 167401 | 228061.7 | 1446723 | 44.16743 |
| 1388-H6 | 19 | 167401 | 237461.3 | 1446723 | 37.94673 |
| 1405-H10 | 19 | 167401 | 271971.7 | 1446723 | 24.69803 |
| 1389-B10 | 19 | 167401 | 87026.33 | 1446723 | -37.192 |
| 1400-C4 | 19 | 167401 | 146922 | 1446723 | -139.539 |
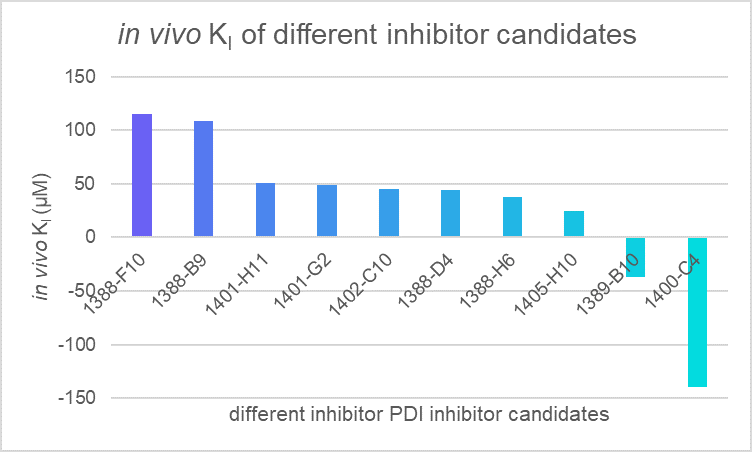
Figure 1. in vivo KI of different PDI candidates
References
- Stanley, S. Y. et al. Anti-CRISPR-Associated Proteins Are Crucial Repressors of Anti-CRISPR Transcription. Cell 178, 1452-1464.e1413, doi:https://doi.org/10.1016/j.cell.2019.07.046 (2019).